Don't want to watch single stocks but afraid to guess: what an ETF does for youWhat a US ETF is, how it differs from single stocks, how to pick
Buying an ETF adds fund shares to your account. Whether those shares give you the exposure you want depends on the objective, full holdings and costs. Start with a real fund page, then carry that information through to the quote and order.
In this article
- The position in your account is a fund share
- Read the QQQE page from its objective
- Which risks does the portfolio spread?
- The expense ratio is not an annual account invoice
- Why the fund's return differs from its index
- Leverage, inverse exposure and a daily objective
- Bring the fund information back to the order screen
- Two questions that arise during ownership
The position in your account is a fund share
After buying a stock ETF, your account shows a fund ticker and a quantity of fund shares. The fund holds stocks or other assets, and your shares give you a proportionate interest in that portfolio and its income. Your brokerage account does not separately register a holding in every portfolio company.
That changes what you need to read. A company share calls for an understanding of that company's business; a fund also calls for an understanding of its investment objective, actual assets and weighting rules. This guide focuses on stock index ETFs. The letters ETF alone do not identify a benchmark or establish that the fund covers the whole market.
Read the QQQE page from its objective
The screenshot below comes from Direxion's official QQQE page. Start at Objective and read the full benchmark name: NASDAQ-100 Equal Weighted Index. Equal Weighted is part of the objective. Omitting those words would turn it into a different description from the usual modified-market-cap-weighted Nasdaq-100.
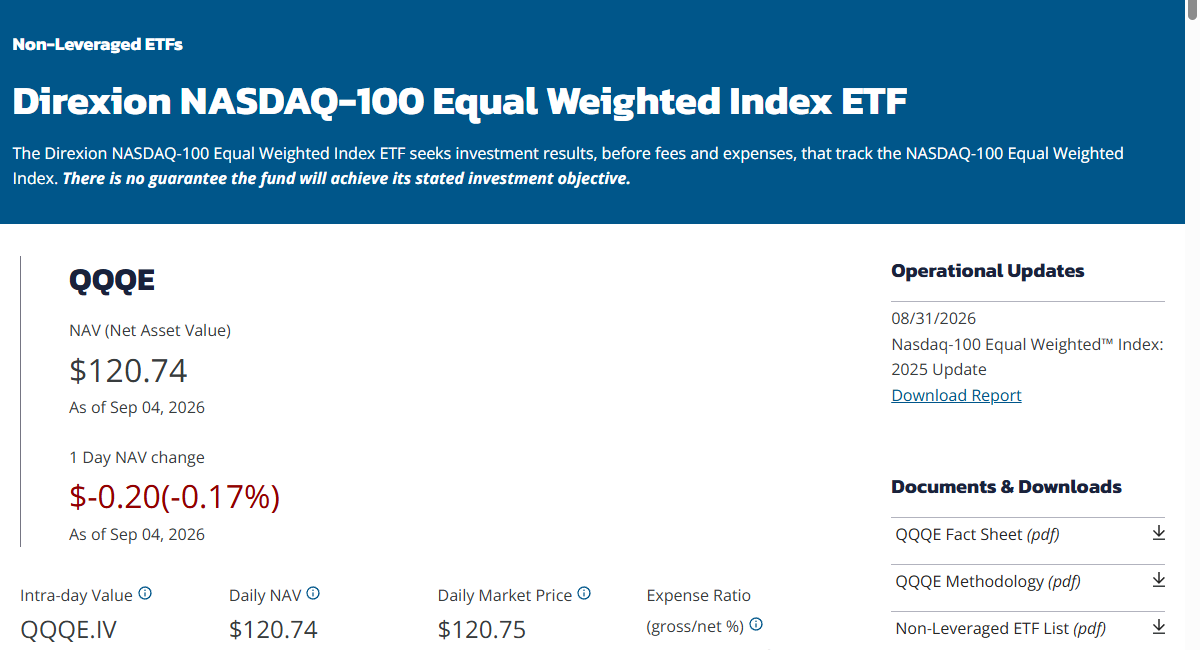
The figures nearby answer different questions. NAV is the fund's net asset value per share; Market Price is a traded price; Expense Ratio describes fund expenses; Assets Under Management measures fund size. A lower share price does not by itself mean a lower holding cost. The screenshot includes the dates shown when it was captured: use it to recognise the fields, not to price an order today.
A product homepage may show only leading holdings. To assess concentration, find the full Holdings file and its date. Read the security names, identifiers and weights, then the combined weight of the largest positions and the sector mix. A fund can have many holdings while a small group of companies or one industry still drives much of its exposure.
If you already hold other funds or individual stocks, include them in the comparison. Two ETF tickers can represent repeated exposure to the same large companies. The index and fund-overlap guide works through that calculation. Counting fund names does not measure how much diversification the second fund adds.
Which risks does the portfolio spread?
A stock fund holding companies across several industries can reduce the concentrated influence of one company. The size of that influence depends on the company's portfolio weight and what happens to the other holdings. It does not justify predicting that a particular bad announcement will barely affect an ETF.
With an individual share, the position follows that company's price. In a fund, the company's contribution enters through its weight, alongside the performance of the other assets. That is a difference in exposure, not a promise that every ETF will be less volatile than every individual stock. Sector, thematic and other concentrated funds can be affected together by the same developments.
Buying exposure across industries and adding exposure to one industry are different objectives. The fund mandate, holdings and weights show which one a product actually serves. Selecting a fund also does not remove the need for research: the objective, holdings and costs can still require attention during ownership.
The expense ratio is not an annual account invoice
The expense ratio is annual fund operating expenses as a percentage of average net assets. The fund pays those expenses from its assets, and they affect NAV and returns. They do not usually appear as a separate year-end debit for the same amount in your brokerage account.
For a simple hypothetical sense of scale, an average holding value kept at $10,000 with an annual expense ratio of 0.20% corresponds to about $20; 0.50% corresponds to about $50. A real holding changes value, and expenses accrue under the fund's terms. This is an arithmetic illustration, not a precise personal annual bill or a fee quote for either fund.
If you are using a published fund return that already includes those expenses, do not subtract the same ratio again. Brokerage commission, bid–ask spread, conversion and transfer charges may still sit outside that return. The trading-fees guide explains costs created by the way you enter, trade and leave the position.
Before comparing two expense ratios, establish that the investment targets and rules are comparable. A lower fee does not correct a mismatch in what the fund holds. Where a fee waiver is temporary, record its conditions and end date as well as the reduced figure.
Why the fund's return differs from its index
An index objective and the delivered result are separate things. Expenses, cash retained in the portfolio, trades around constituent changes and valuation timing can contribute to a difference. Compare fund and benchmark returns for the same dates, currency and dividend treatment, rather than lining up two figures simply because both say one year.
Suppose, purely for illustration, a fund's total return over a period is 5.7% and the corresponding index total return is 6.0%. The return difference for that period is −0.3 percentage points. That number does not explain the cause or establish how consistently the fund tracked over time. If a factsheet reports tracking error, read the calculation method and observation period rather than treating one period's shortfall as the entire measure.
Your executed market prices add another distinction. A personal trade return reflects when and at what price you bought and sold, including relevant trading costs; a published NAV return measures the fund over its stated period. Comparing the two can mix execution choices with fund performance. Direxion's ETF pricing explanation distinguishes closing NAV from market price.
Leverage, inverse exposure and a daily objective
Those words change the task the fund is trying to perform. When the objective targets a multiple or an inverse of an index's daily performance, the observation period is essential to understanding the product.
For a daily-reset fund, returns over several days depend on compounding and the path of prices. Multiplying the index's total return over a longer period by the stated daily multiple does not generally reproduce the fund's result. Direxion's explanation of daily-reset risk discusses that distinction.
This mechanism is different from the ordinary stock-index holdings discussed above. Identify the assets or derivatives used and the period addressed by the objective in the fund documents. The general idea that an ETF spreads holdings cannot answer those product-specific questions.
Bring the fund information back to the order screen
Match the full fund name and ticker on the broker's ticket to the factsheet, then examine the trading currency, bid and ask, order type and session. The difference between bid and ask affects entry and exit costs. A currently executable price need not equal the latest published NAV.
Fund size and volume provide background, but neither supplies a universal threshold that guarantees execution at your expected price. The current quote, available quantity and relevant market hours matter for the actual order. A limit can set a maximum purchase price or minimum sale price while leaving the order unfilled.
A useful holding record can be brief: the full name, objective and benchmark, principal holdings and their date, expense ratio, and what the fund adds to your existing companies or sectors. If the description still amounts only to “an ETF,” the useful information on the product page has not yet made it into the decision.
Getting funds into the account is a separate practical step. The funding guide explains how to read accepted sources and currencies. A security being available for trading does not establish that any payment method is accepted.
Two questions that arise during ownership
Must every fund holding match the index at every moment?
The words “tracks an index” do not establish an identical file at all times. Holdings dates, cash, adjustment timing and the fund's implementation method can affect the detail. Read the investment strategy and compare complete fund holdings with benchmark information for the same date to identify the difference.
Do I need to return to the factsheet after buying?
Follow fund notices and changes in the objective, expenses and holdings, particularly when a fee waiver ends or the portfolio or product arrangements change. Keeping the original investment reason and document dates provides a basis for deciding whether the fund still performs its intended role.
Educational content. Calculation examples use stated assumptions; linked rules and dated screenshots are identified in context. Check current account and product terms before acting. Content reviewed September 9, 2026.